Dear Reader:
Nintendo FY3/2020 Q3 earnings results (Switch hardware hits 52 million sold, forecast revised up)
![]()
Nintendo has come in with their FY3/2020 Q3 earnings results, which is chock full of sales figures and more. Check out the full report analysis below.
Overall data and million sellers
+--------------------------------------------------------------------------+
| | This Quarter | FY Cumulative | FY Forecast |
+--------------------------------------------------------------------------+
| Net Sales | ¥578,701M | ¥1,022,668M (~$9.39B)| ¥1,250,000M |
| Operating Income| ¥168,708M | ¥262,930M (~$2.41B)| ¥300,000M |
| Net Profit | ¥134,371M | ¥196,389M (~$1.8B)| ¥210,000M |
+--------------------------------------------------------------------------+
+---------------------------------------------------------------------------------+
| Switch (units) | This Quarter | FY Cumulative | LTD | FY Forecast |
+---------------------------------------------------------------------------------+
| Switch | 7.58M | 12.56M | 47.3M | |
| Switch Lite | 3.24M | 5.19M | 5.19M | |
| Hardware Total | 10.81M | 17.74M | 52.48M | 19.5M |
| Software Total | 64.64M | 123.13M | 310.65M | 140.0M |
+---------------------------------------------------------------------------------+
(Software sales units include both packaged and downloadable versions of software.)
###
+---------------------------------------------------------------------------------+
| 3DS | This Quarter | FY Cumulative | LTD | FY Forecast |
+---------------------------------------------------------------------------------+
| Hardware Total | 0.25M | 0.62M | 75.71M | 0.65M |
| Software Total | 1.5M | 4.1M | 382.22M | 4.5M |
+---------------------------------------------------------------------------------+
(Software sales units include both packaged and downloadable versions of software.)
###
+------------------------------------------------------------------------+
| | This Quarter | FY Cumulative |
+------------------------------------------------------------------------+
| Smart devices, IP related income, etc.| ¥16,946M | ¥36,910M |
+------------------------------------------------------------------------+
(Includes income from smart-device content and royalty income.)
+--------------------------------------------------------------------------+
| | This Quarter | FY Cumulative |
+--------------------------------------------------------------------------+
| Proportion of overseas sales | 78.6% | 77.8% |
+--------------------------------------------------------------------------+
(※ Proportion of overseas(outside of Japan) sales to total sales)
+--------------------------------------------------------------------------+
| Proportion of hardware sales | 57.4% | 55.6% |
+--------------------------------------------------------------------------+
(※ Proportion of hardware(including accessories) sales to total
dedicated videogame platform sales)
+--------------------------------------------------------------------------+
| Proportion of first party software sales | 87.4% | 82.0% |
+--------------------------------------------------------------------------+
(※ Proportion of first-party software sales to total dedicated video
game software sales)
+--------------------------------------------------------------------------+
| Digital Sales | ¥53.2B | ¥124.9B |
+--------------------------------------------------------------------------+
(※ Digital sales include a) downloadable versions of packaged software,
b) download-only software,c) add-on content and d) Nintendo Switch Online, etc.
* “Downloadable versions of packaged software” indicates the
downloadable version of software that is offered both physically and digitally.)
+--------------------------------------------------------------------------+
| Proportion of Digital Sales | 22.3% | 28.6% |
+--------------------------------------------------------------------------+
(※ Proportion of digital sales to total dedicated
video game software sales )
+--------------------------------------------------------------------------+
|Proportion of DL Ver. of Packaged SW Sales| 71.7% | 65.6% |
+--------------------------------------------------------------------------+
(※ Proportion of downloadable versions of packaged software sales
to total digital sales as indicated above: a/(a+b+c+d) )
+---------------------------------------------------+
| NSW Lite Sell-In WW LTD | Units | Percentage |
+---------------------------------------------------+
| Japan | 1.36M | 26.2% |
| The Americas | 2.09M | 40.27% |
| Other | 0.46M | 8.86% |
| Europe | 1.28M | 24.66% |
+---------------------------------------------------+
|All NSW HW Sell-In WW LTD | Units | Percentage |
+---------------------------------------------------+
| Japan | 12.42M | 23.67% |
| The Americas | 20.87M | 39.77% |
| Other | 5.0M | 9.53% |
| Europe | 13.88M | 26.45% |
+---------------------------------------------------+
###
+---------------------------------------------------+
|Switch SW Sell-In WW LTD | Units | Percentage |
+---------------------------------------------------+
| Japan | 57.34M | 18.46% |
| The Americas | 138.63M | 44.63% |
| Other | 20.68M | 6.66% |
| Europe | 94.01M | 30.26% |
+---------------------------------------------------+
###
+----------------------------------------------------------------+
| New Titles (Switch) | This Quarter | FY Cumulative| LTD |
+----------------------------------------------------------------+
| Japan | 96 | 210 | 508 |
| The Americas | 86 | 244 | 629 |
| Other | 84 | 254 | 633 |
+----------------------------------------------------------------+
+-------------------------------------------------------------------------------------------------+
| Title | FY Japan | FY Overseas | FY Global | Global LTD |
+-------------------------------------------------------------------------------------------------+
| Super Mario Maker 2 | 1.12M | 3.92M | 5.04M | 5.04M |
| The Legend of Zelda: Link's Awakening | 0.42M | 3.77M | 4.19M | 4.19M |
| Mario Kart 8 Deluxe | 0.68M | 5.59M | 6.27M | 22.96M |
| The Legend of Zelda: Breath of the Wild | 0.35M | 3.21M | 3.0M | 16.34M |
| New Super Mario Bros. U Deluxe | 0.26M | 2.28M | 2.54M | 5.85M |
| Astral Chain | 0.16M | 0.87M | 1.03M | 1.03M |
| Ring Fit Adventure | 0.63M | 1.54M | 2.17M | 2.17M |
| Super Mario Party | 0.46M | 2.26M | 2.72M | 9.12M |
| Pokémon Sword/Shield | 4.21M | 11.85M | 16.06M | 16.06M |
| Super Smash Bros. Ultimate | 0.69M | 3.18M | 3.87M | 17.68M |
| Luigi's Mansion 3 | 0.73M | 4.65M | 5.37M | 5.37M |
| Marvel Ultimate Alliance 3 | 0.04M | 0.98M | 1.02M | 1.02M |
| Splatoon 2 | 0.34M | 0.76M | 1.1M | 9.81M |
| Fire Emblem: Three Houses | 0.53M | 2.04M | 2.58M | 2.58M |
| Pokémon: Let's Go Pikachu/Eevee | 0.12M | 1.0M | 1.13M | 11.76M |
| Super Mario Odyssey | 0.16M | 1.99M | 2.15M | 16.59M |
+---------------------------------------------------------------------------------------------------+
| Switch - Top Selling Titles (units) | This Quarter| LTD |
+----------------------------------------------------------------------+
| Mario Kart 8 Deluxe | 3.95M | 22.96M |
| Super Mario Odyssey | 1.21M | 16.59M |
| Super Smash Bros. Ultimate | 1.97M | 17.68M |
| The Legend of Zelda: Breath of the Wild | 1.8M | 16.34M |
| Pokémon Let's Go Pikachu/Eevee | 0.48M | 11.76M |
| Splatoon 2 | 0.53M | 9.81M |
| Super Mario Party | 1.53M | 9.12M |
| New Super Mario Bros. U Deluxe | 1.26M | 5.85M |
| Luigi's Mansion 3 | 5.37M | 5.37M |
| Pokémon Sword/Shield | 16.06M | 16.06M |
+----------------------------------------------------------------------+
| 3DS - Top Selling Titles (units) LTD |
+----------------------------------------------------------------------+
Mario Kart 7 - 18.68 million
Pokémon X and Y - 16.44 million
Pokémon Sun and Moon - 16.18 million
Pokémon Omega Ruby and Alpha Sapphire - 14.26 million
New Super Mario Bros. 2 - 13.32 million
Super Mario 3D Land - 12.67 million
Animal Crossing: New Leaf - 12.45 million
Super Smash Bros. for Nintendo 3DS - 9.57 million
Pokémon Ultra Sun and Ultra Moon - 8.70 million
Tomodachi Life - 6.55 million
+----------------------------------------------------------------------+
Various tidbits
- the traditional Switch continued to see strong sales even after the launch of Switch Lite
- total number of million-seller titles during this fiscal year is at 21
- steady growth in sales of downloadable versions of packaged software and download-only software
- mobile related income saw a 10.6% increase on a year-on-year basis
- Nintendo will continue to convey the appeal of both the Nintendo Switch and Nintendo Switch Lite hardware
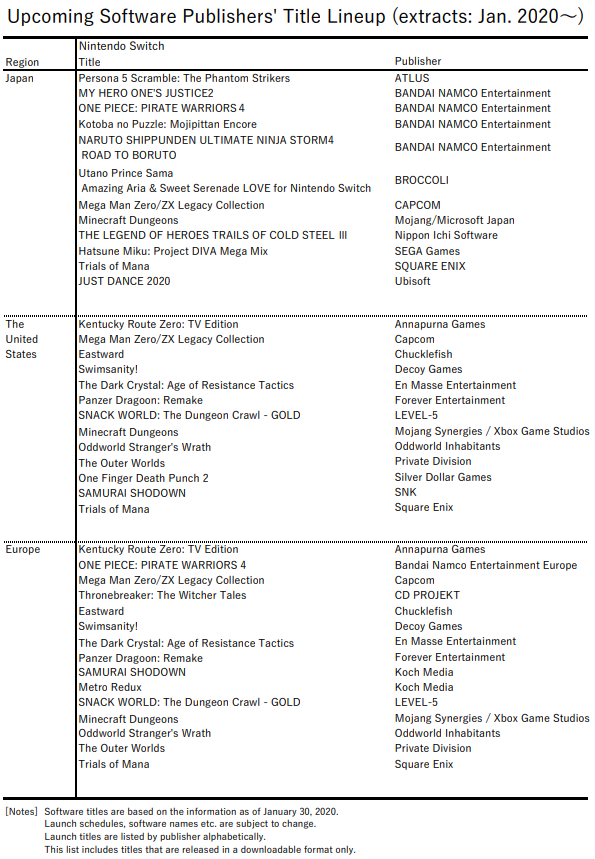
- there is a robust variety of appealing titles from other software publishers scheduled to be released
- Nintendo will work to keep the platform energized by continuously introducing attractive new titles
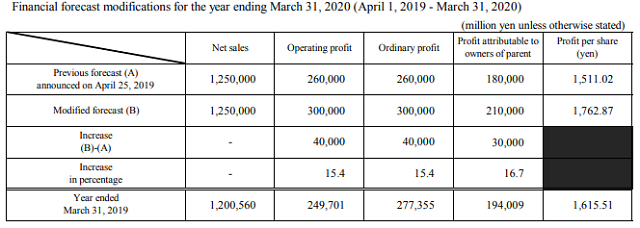
Revised forcast
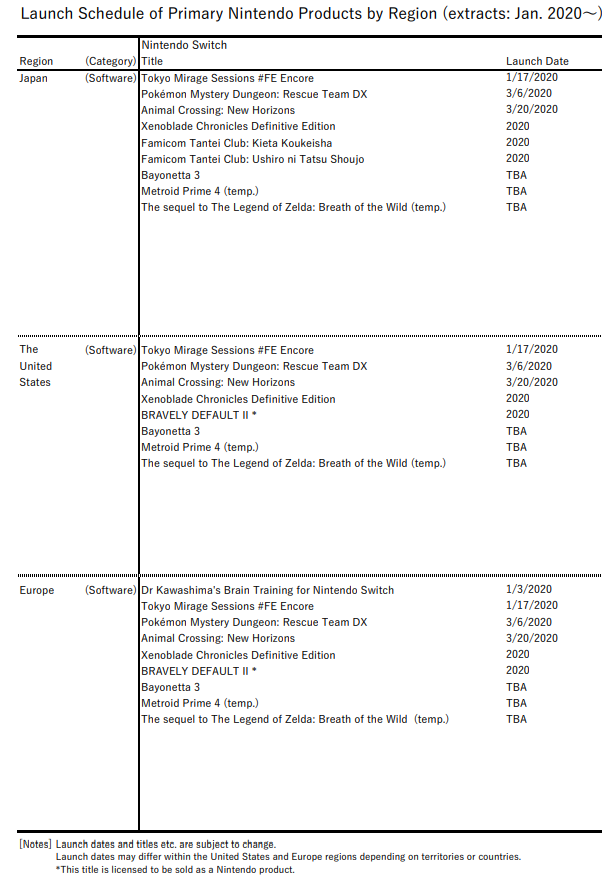
Release schedule